“Deep and Infrequent” – that’s been the mantra for effective turf irrigation. Unfortunately, it isn’t always true, or at least not the same, for all climate and soil conditions. A good irrigation strategy will maintain the soil moisture at levels appropriate for the turf – not too dry, not too wet. By understanding a simple soil moisture model, “deep and infrequent” can be refined into specific guidelines for different lawns.
This article goes beyond “1 inch per week” and considers the science behind that recommendation.
Soil Moisture Properties
The amount of water a soil can hold depends on the distribution of micropores within the soil and can be predicted by the soil texture. When a soil becomes saturated (all pores are filled with water) after an extended and heavy rainfall, gravity pulls much of that water below the root zone. After a day or so, the water that remains is held in place by capillary and cohesive forces. This amount of water is the “Field Capacity” of the soil. When the soil moisture in the root zone is at Field Capacity, any added water will be lost to the roots through deep-infiltration, runoff and/or surface evaporation.
As the plant roots take in water, soil moisture drops below the Field Capacity. But turf roots cannot remove it all – some water will remain bonded to the soil particles by capillary forces too strong for normal grass roots to overcome. The soil moisture level at which roots can no longer retrieve water is the “Permanent Wilting Point”. Although water may remain in the soil, it is unavailable to the plants, and they will wilt. Clay soils with many small micropores have a high PWP – they can hold an appreciable amount of water without any of it being available to the plant roots.
The amount of soil moisture between the Field Capacity and Permanent Wilting Point is the “Available Water Capacity” – this is the maximum amount of water in the soil that is available for plant use. The AWC varies with soil texture. Loams, clay loams and silt loams have the highest AWC. They hold a lot of moisture, but not so tightly that the plants can’t access it. Available Water Capacity is often measured in inches of water per foot of soil [in/ft].
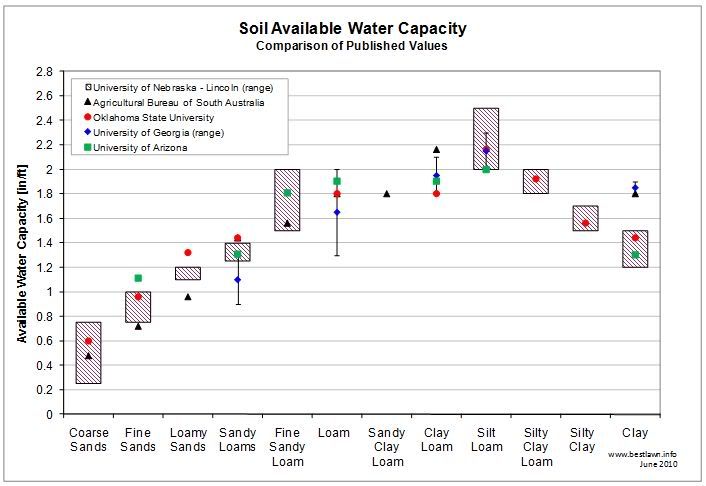
Figure 2: Available Water Capacity [i]
Root Depth
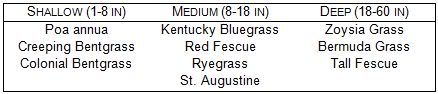
The reservoir of moisture available for plant use is contained within the root zone – deeper roots have a larger volume of soil from which to draw water. Multiplying the AWC by the root depth gives the size of the available moisture reservoir in inches of water. While healthy established turf grown in deep soil can have roots several feet deep, the following table gives more reasonable estimates. The maturity and health of the turf, along with the local sub-soil conditions, may severely limit the effective root zone.
Potential Rootdepth of Turfgrass Species [ii]
When the turf is fully watered, the soil moisture within the root zone is at 100% AWC. Most plants will begin showing signs of stress when the moisture level drops to 50% AWC – this is the time to irrigate. Enough water should be applied to return the soil moisture to 100% AWC, so the amount of irrigation required per session is 50% AWC × root depth. Any additional water applied beyond 100% AWC saturates the soil and will ultimately be lost from the root zone.
Evapotranspiration Rate
Evapotranspiration is the loss of soil moisture through surface evaporation and leaf transpiration and is a function of weather (solar intensity, wind, humidity, temperature, etc.) and crop (turf) characteristics. The reference evapotranspiration rate (ETo) represents the evapotranspiration from a reference crop growing in soil with freely available moisture. The ETo can be measured directly in a research setting, measured indirectly using special apparatus, or modeled using weather measurements (solar intensity, wind, humidity, temperature, etc.). Various extension, agricultural and climate agencies have regional stations that report daily ETo values, but the data is not readily available for all areas and may use different reference standards or model calculations. [iii] Some high-end personal weather stations can also calculate ETo with the proper hardware and software. The ET rate can vary greatly over local microclimates - a consideration when selecting a source for ETo data.
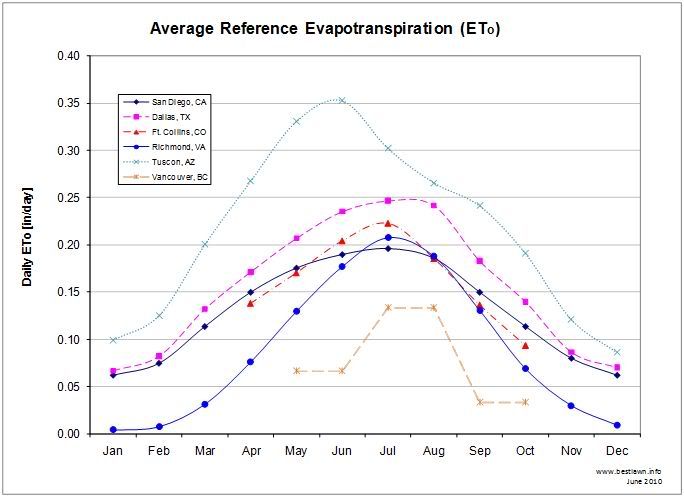
Figure 3: Reference Evapotranspiration Rates [iv]
Two coefficients are typically applied to the ETo – a crop coefficient (Kc) and quality factor (QF). The crop coefficient is used to relate the crop (or turf) under consideration to the reference crop. For established cool-season turf grasses, Kc = 0.8 for most of the growing season. Warm-season grasses generally manage water more efficiently, and Kc = 0.6 is typical. Crop coefficients can vary as the plant roots and leaf canopy emerge from winter dormancy and mature through the season. [v]
The QF is a fudge factor between 0 – 1 used to modify irrigation rates in times of drought or water rationing, or to distinguish between high-value (putting greens) and low-value (parking median) irrigation zones.
Water Balance Calculation
From the AWC and root depth, we can estimate the size of the soil moisture reservoir. From the evapotranspiration rate and applicable coefficients, we can determine the rate at which that reservoir is depleted. Now it is a simple exercise to calculate the frequency and amount of irrigation to keep the turf happy.
As an example, how often (and how much) should mature St. Augustine turf in Dallas, Texas be watered in July when grown in a clay-loam soil? (Assume a root depth of 12 inches.)
To prevent stress, the turf should be watered when the moisture reservoir is depleted by 50%. Using an AWC of 2 in/ft (for clay loam from the AWC graph) and a 1 ft root depth:

Since 50% AWC is the depletion amount to trigger irrigation, it is also the amount of water required to resupply the soil. So when the soil moisture reservoir is depleted by 1 inch, 1 inch of water needs to be applied through irrigation.
Using an average ETo of 0.25 in/day from the evapotranspiration graph and a crop coefficient for warm season turf of 0.6, the average period between irrigations (time required for the soil to lose 1 inch of water) is determined:
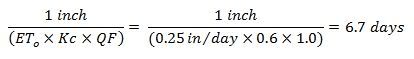
So, the estimate to replenish the soil moisture reservoir is 1 inch of water every 7 days – that’s where the recommendation comes from.
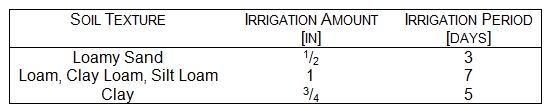
Guidelines based on soil texture can be given using average root depths and evapotranspiration rates in the calculations above:
General Irrigation Guidelines
.
By understanding the soil moisture model and applying the specific turf conditions (soil texture and AWC, root depth and ET rates), the lawn enthusiast has another tool for irrigation management. But using this simple water balance model to determine the period between irrigations just provides an estimate, and local rainfall hasn’t been addressed at all. The next step is to use a daily water balance model to trigger irrigation – this will be discussed in a future article.
But however sophisticated the model, nothing works better at determining when to irrigate than watching the turf for signs of stress – that’s the best way to know when to water.
References
[i] Klocke and Hergert, “G90-964: How Soil Holds Water”, University of Nebraska-Lincoln Extension, 1990; Bulletin 462, Agricultural Bureau of South Australia, 1960; “Soil-Water Relationship”, Biosystems and Agricultural Engineering, Oklahoma State University; Carrow and Waltz, “Turfgrass Soil & Water Relationships”, University of Georgia, 1985; Norton and Silvertooth, "Field Determination of Permanent Wiliting Point", University of Arizona, 1998.
[ii] Wu, Lin, “Matching Irrigation to Turfgrass Root Depth”, California Turfgrass Culture, 1985.
[iii] A Sample of ETo Reporting Sites
California: California Irrigation Management Information Systems
Texas: Texas ET Network
Arizona: Arizona Meteorological Network
Colorado: ColoradoET.org
Louisiana: LSU Ag Center: Louisiana Agriclimatic Information
Wisconsin & Minnesota: UW Extension Ag Weather
Florida: Florida Automated Weather Network
Northeast States: Northeast Regional Climate Center
British Columbia: Farmwest.com
[iv] Reference Evapotranspiration Zones Map, California Irrigation Management Information System, 1999; Irrigation Technology Center, Texas A&M AgriLife Extension; “Historical Reference ET for Northern Colorado Front Range”, Northern Colorado Water Conservancy District, 2006; “Virginia Potential Evapotranspiration…”, University of Virginia Climatology Office; AZMET Historical ETo, Arizona Meterological Network; “Evapotranspiration Rates for Turfgrass in British Columbia”, Ministry of Agriculture, Food and Fisheries, 2002.
{The Virginia data is for ‘potential evapotranspiration’, a value calculated slightly differently from the reference ET reported by the other agencies here.}
[v] See Snyder, et al. “Crop Coefficients”, University of California, 2007.